AVWAP [BLT]
Know exactly where institutions entered.
Professional Anchored VWAP automatically tracks institutional price levels so you stop guessing where support and resistance actually are.
The Solution
AVWAP [BLT] plots the Anchored Volume-Weighted Average Price from any point that matters — a session open, a swing high or low, an earnings date, or a bar you pick yourself. Instead of eyeballing where "value" sits, you get the exact price level where the market has actually built its average position since that moment — the same reference institutional desks use internally.
Why It Works
Never Guess Support & Resistance Again
Anchor to session, week, month, year, or any swing point — AVWAP hands you an objective level instead of a hand-drawn line.
Spot Extended Moves Before They Reverse
Optional ±1 and ±2 SD bands flag statistically stretched price, so mean-reversion setups come with a level to trade against instead of a hunch.
Track Every Anchor At Once
Run multiple AVWAPs simultaneously to see how institutional value has shifted across several timeframes at a glance.
Never Miss The Cross
Price-cross alerts fire the moment price reaches an anchored level, so you're not stuck watching the chart all day.
Bullish Bias
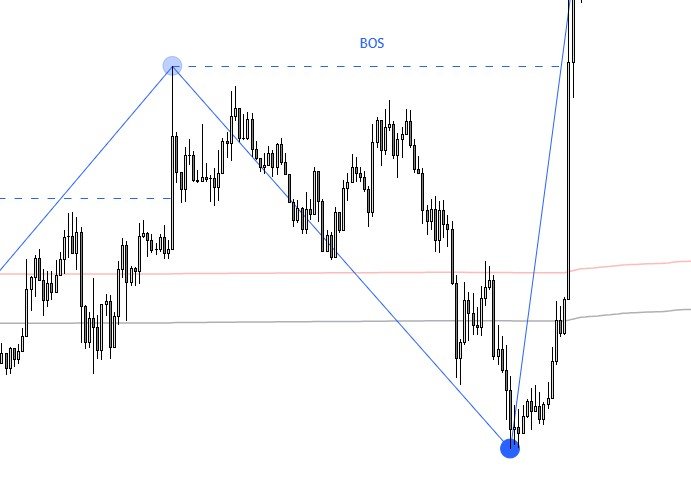
Price holding above the anchored VWAP means buyers have been in control since the anchor. Pullbacks to AVWAP become long entries instead of guesses.
Bearish Bias
Price staying below AVWAP means sellers have dominated since the anchor. Rallies back to AVWAP become short entries.
Band Extensions
Price touching +2 SD from AVWAP is statistically stretched. Fade moves into the outer bands with tight risk management.
Settings Reference
Anchor Source
Session Open · Week Open · Month Open · Year Open · Swing High · Swing Low · Manual Bar
Display
Line width, colour, transparency, and whether SD bands are shown. All configurable per anchor.
Alerts
Enable or disable per-line crossing alerts. Compatible with TradingView webhook alerts.